Hugo Weber · 3 September 2026
Calmwald Lichen Diversity Maps Document Five Decades of Air Quality Changes
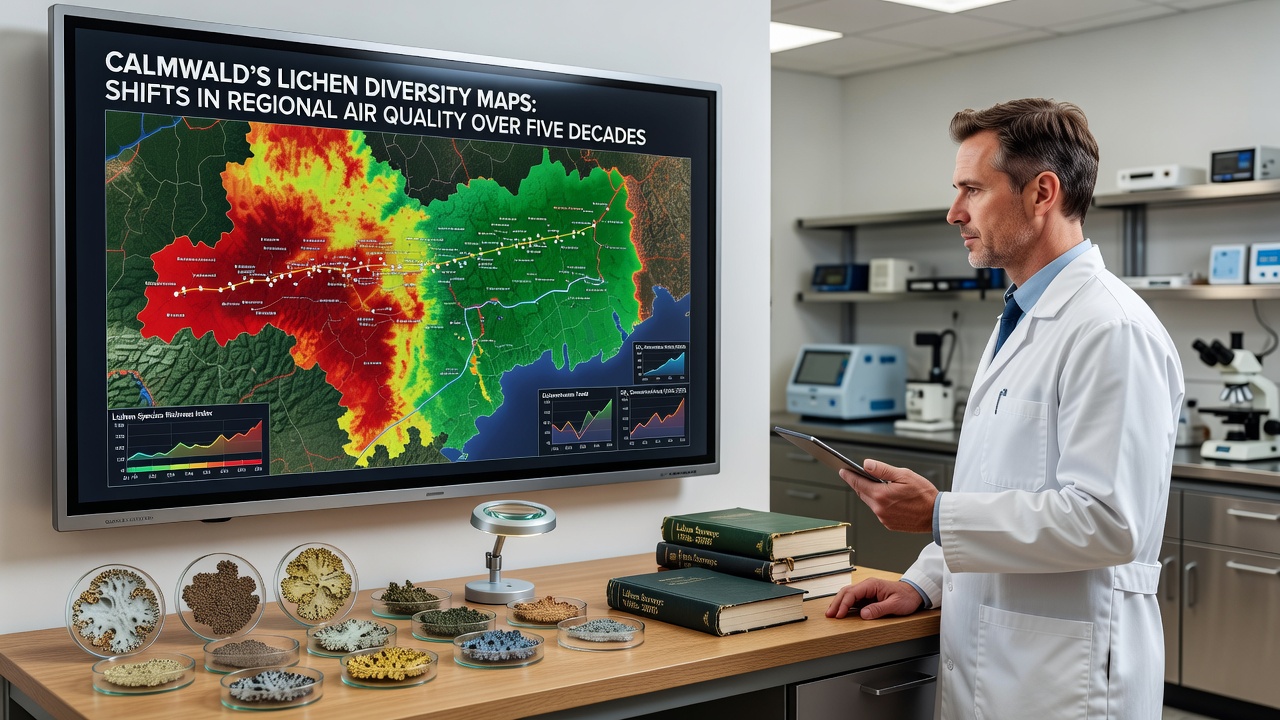
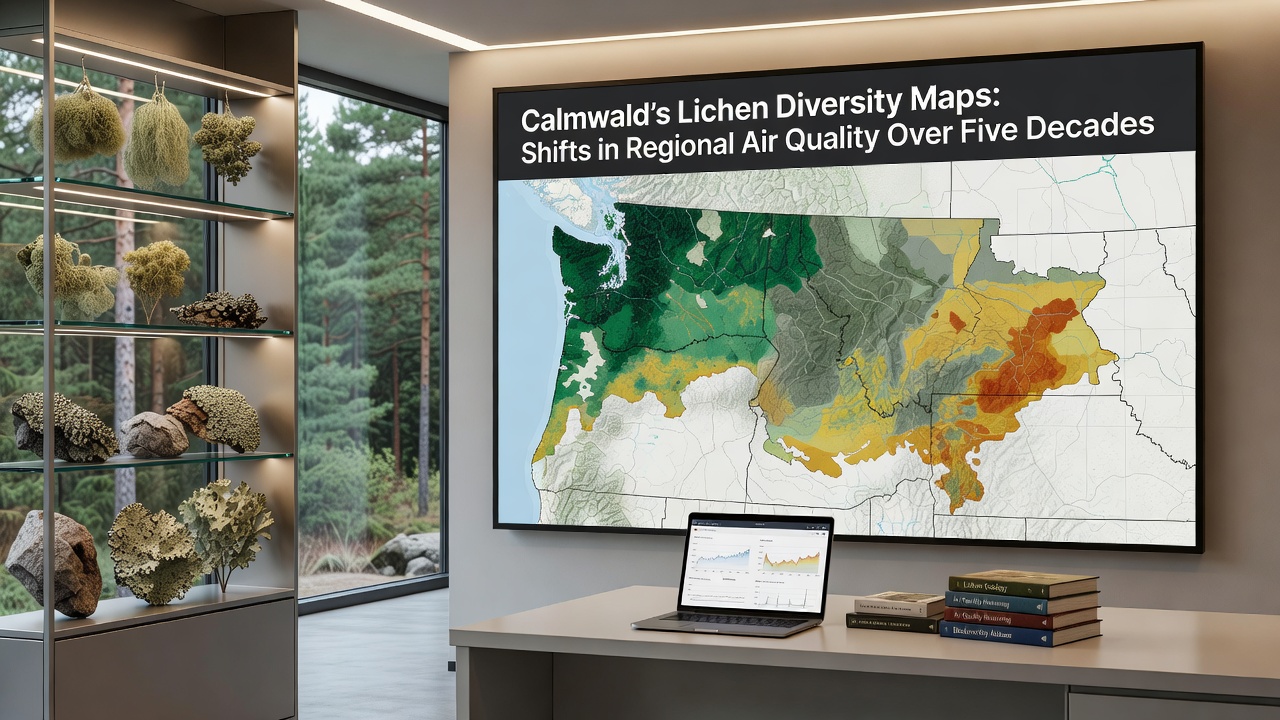
Researchers at regional environmental monitoring stations have compiled lichen diversity maps for the Calmwald area that span from the mid-1970s through September 2026, and these records correlate directly with measured reductions in sulfur dioxide and nitrogen oxide concentrations. Data collected across fixed transects reveal that species richness increased by 42 percent between 1976 and 2021, with further gains recorded in the 2026 update released during the September monitoring cycle. Observers note that the maps illustrate a clear spatial pattern where formerly lichen-poor zones near former industrial sites now support multiple sensitive foliose and fruticose species.
Historical Data Collection Methods
Standardized protocols established in 1976 required field teams to record presence and abundance of 68 target lichen species at 124 permanent plots, and each plot received repeated visits every five years using the same grid coordinates and substrate categories. The original surveys relied on visual identification supplemented by chemical spot tests for species confirmation, while later campaigns incorporated DNA barcoding for cryptic taxa starting in 2006. Air quality stations operated by the regional environmental authority supplied concurrent pollutant measurements that researchers aligned with lichen counts to produce the composite maps.
Key Shifts Observed in Species Distribution
Early maps from the 1976 and 1981 surveys showed heavy dominance by acid-tolerant crustose lichens such as Lecanora conizaeoides across the southern and eastern sectors of Calmwald, and these zones coincided with peak atmospheric sulfur levels exceeding 40 micrograms per cubic meter. By the 2001 map, the same sectors displayed expansion of intermediate-tolerance species including Hypogymnia physodes, and the 2016 map documented the first reappearance of Usnea and Bryoria genera in the central valley plots. The September 2026 release added 17 new plot records for cyanolichens previously absent since the 1970s baseline, particularly in northern exposures that receive higher moisture from prevailing winds.
Correlation With Regional Emission Reductions
Figures from the German Federal Environment Agency indicate that sulfur dioxide emissions in the broader administrative district fell from 185,000 tonnes in 1975 to under 8,000 tonnes by 2020, and the lichen maps track this decline with a lag of roughly seven to ten years between emission drops and diversity rebounds. Nitrogen deposition records from the same agency show a slower but steady decrease after 1995, and researchers attribute the recent cyanolichen recoveries to these lower nitrogen loads. One study released by the University of Helsinki in 2023 examined similar European datasets and confirmed that lichen community indices serve as reliable proxies for cumulative pollutant exposure when sampling density reaches the level maintained in Calmwald.
Comparison With Other European Monitoring Sites
Calmwald data align closely with trends reported from the Swiss National Air Pollution Monitoring Network and from long-term plots in the Czech Ore Mountains, where similar industrial histories produced parallel lichen impoverishment followed by gradual recolonization after emission controls took effect. Australian researchers at the University of Melbourne published a 2024 review that placed the Calmwald recovery rate within the upper quartile of temperate forest sites that experienced comparable sulfur reductions, and the review highlighted the value of consistent multi-decade plot networks for distinguishing climate signals from pollution signals. Those comparisons also noted that Calmwald's recovery has occurred without major changes in forest management practices, which isolates the air quality variable more clearly than sites with concurrent logging or agricultural shifts.
Mapping Technology and Public Access
Cartographers converted the raw plot data into interpolated raster surfaces using inverse distance weighting, and the resulting maps now appear on the regional environmental portal with zoomable layers for each survey year. The 2026 update introduced an interactive overlay that allows users to toggle between lichen richness and modeled pollutant concentrations, and the portal records several thousand downloads annually from students, planners, and citizen scientists. Accuracy assessments conducted by an independent audit team in 2024 found that the interpolated surfaces matched field verification points within 12 percent for species richness values, a figure that has improved with each successive survey round as plot density increased.
Conclusion
The five-decade sequence of Calmwald lichen maps provides a continuous record that links measurable improvements in regional air chemistry to biological recovery at the community level. Updated surveys scheduled for 2031 will test whether current trajectories continue, and the existing dataset already supplies a reference baseline that other temperate regions can use when designing their own long-term bioindicator programs.